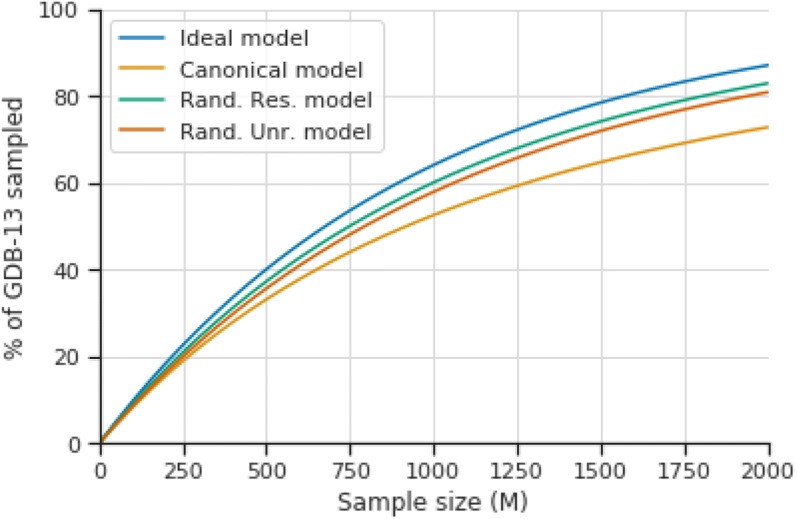
Fig. 3.
Plot illustrating the percent of GDB-13 sampled alongside the sample size of the ideal model (blue) and the best of the canonical (yellow), randomized restricted (green) and randomized unrestricted (orange) models. Notice that the ideal model is always an upper bound and eventually () would sample the entire GDB-13. The trained models would reach the same point much later

