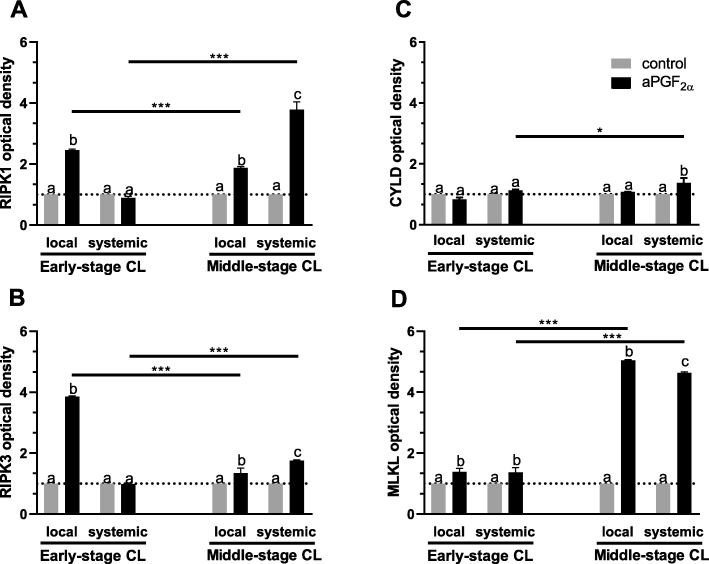
Fig. 10.
The arithmetic means of intensities of: (a) RIPK1, (b) RIPK3, (c) CYLD and (d) MLKL in the bovine early- and middle-stage corpora lutea (CL) after local or systemic PGF2α analogue (aPGF2α) administration. The gray bars represent the control group, and the black bars represent local or systemic aPGF2α administered groups. Letters a,b,c indicate statistical differences between all experimental groups in the early and middle- stage CL. Asteriks * indicate statistical differences between local/systemic aPGF2α injected early-stage CL vs local/systemic aPGF2α injected middle-stage CL

