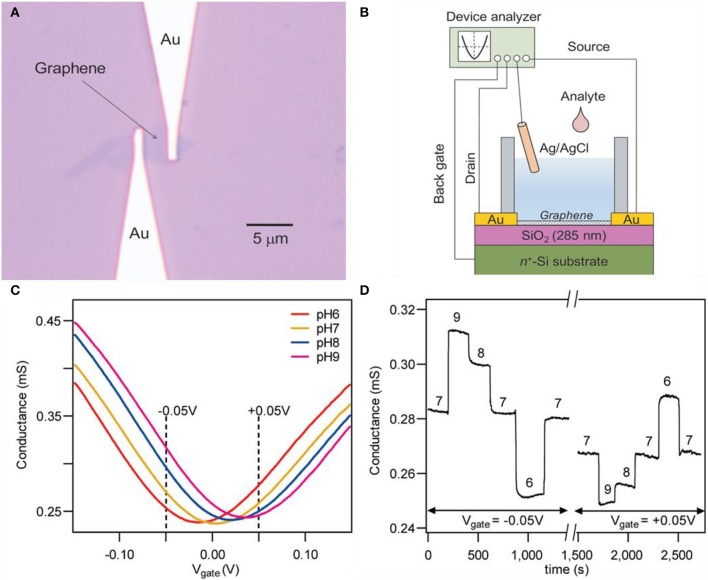
Figure 2.
Pristine graphene pH sensors. (A) Optical microscope image of a graphene field effect transistor. (B) Experimental setup scheme illustration of a graphene field effect transistor. Figures (A,B) were reproduced from Ohno et al. (2009) with permission from the American Chemical Society. (C) Typical transfer curves and (D) time–current curves of a graphene field effect transistor. Figures (C,D) were reproduced from Cheng et al. (2010) with permission from the American Chemical Society.

