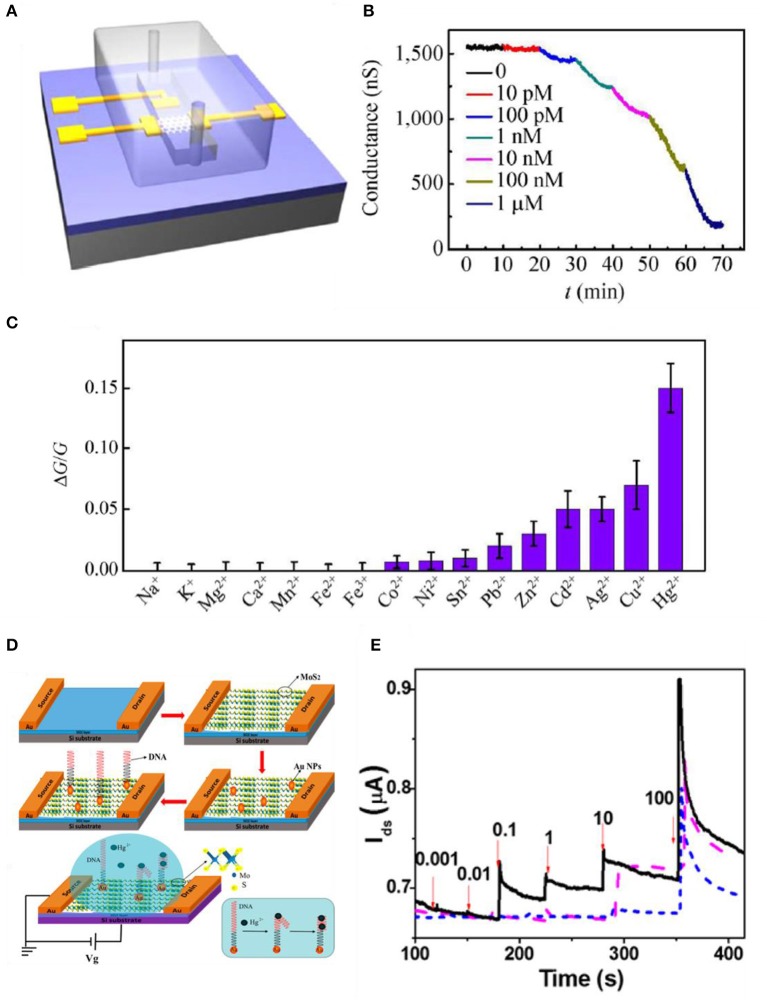
Figure 8.
MoS2-based FET metal ion sensors. (A) Schematic diagram of microfluidic channel onto MoS2 device. (B) Sensing curve data using low-concentration Hg2+ ions. (C) Selectivity to various metal ions having a concentration of 1 nM. Figures (A–C) were reproduced from Jiang et al. (2015) with permission from Springer. (D) Illustration of manufacturing process of MoS2 based FET. MoS2/DNA-Au NPs hybrid structure is shown. (E) Real-time sensing curves of Hg2+ (nM) in water (VDS = 0.1 V), MoS2/DNA-Au NPs (black, solid), MoS2-Au NPs (purple, dash), MoS2 (blue, short dash). Figures (D,E) were reproduced from Zhou et al. (2016) with permission from the American Chemical Society.

