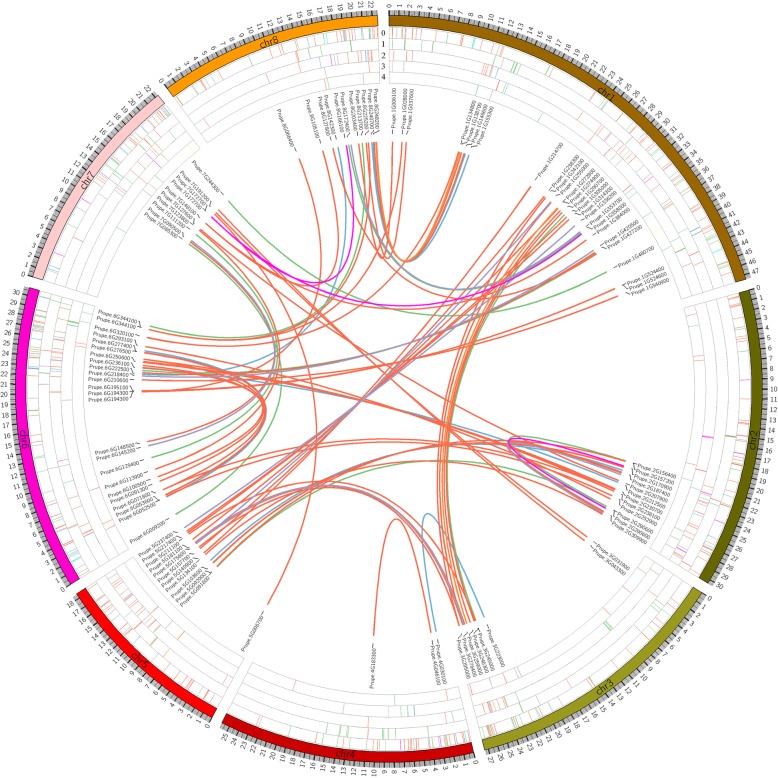
Fig. 1.
Genomic distribution and duplication of the PpE3 ligase genes across the 8 chromosomes of peach. The E3 genes are shown with the chromosome on which the occur. Syntenic pairs are linked with lines, with colors representing each subfamily: BTB, blue; Cullin, orange; DDB, yellow; F-box, green; HECT, cyan; RING, red; SKP magenta; and U-box, purple. Each concentric layer represents a type of gene duplication: Layer 0 represents DSD; Layer 1, tandem duplication (TD); Layer 2, whole-genome duplication (WGD); Layer 3, proximal pairs (PD); and Layer 4, singletons

