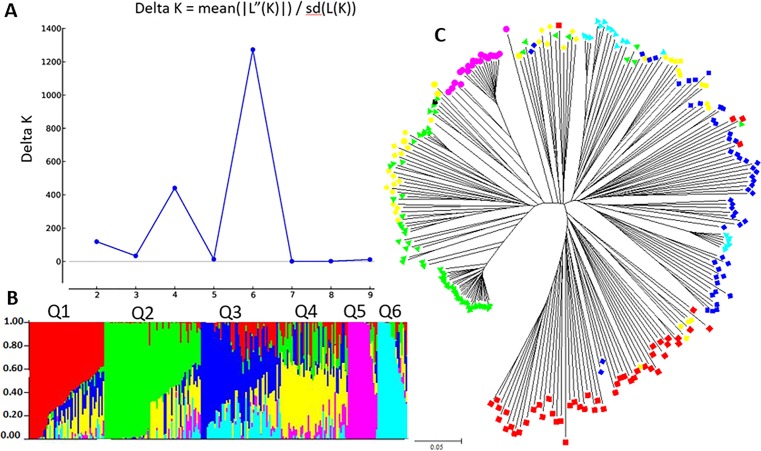
Figure 2.
Structure analysis: (A) Delta K values for different numbers of populations (K) from the STRUCTURE analysis, x-axes shows different numbers of populations (K), y-axes shows Delta K values for different numbers of populations (K). (B) Classification of 249 accessions into six sub-populations using STRUCTURE version 2.3.4, where the x-axis shows accessions, and the y-axis shows the probability (from 0 to 1) of each accession belong to sub-population (Q = K) membership. The membership of each accessions belonging to sub-populations is indicated by different colors (Q1, red; Q2, green; Q3, blue; Q4, yellow; Q5, pink; and Q6: cyan). (C) Maximum Likelihood (ML) tree of the 249 accessions drawn in MEGA 6. The color code for each subpopulation is the same as that in the (B and C).

