Figure 5.

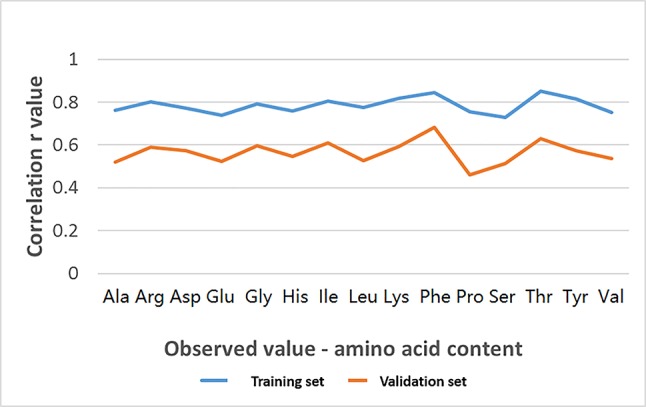
The average correlation coefficient (r) among 15 amino acids between the observed values (each amino acid concentration) and the GEBVs predicted in both training set and validation set from the 231 SNP markers using cBLUP method in GAPIT.

The average correlation coefficient (r) among 15 amino acids between the observed values (each amino acid concentration) and the GEBVs predicted in both training set and validation set from the 231 SNP markers using cBLUP method in GAPIT.