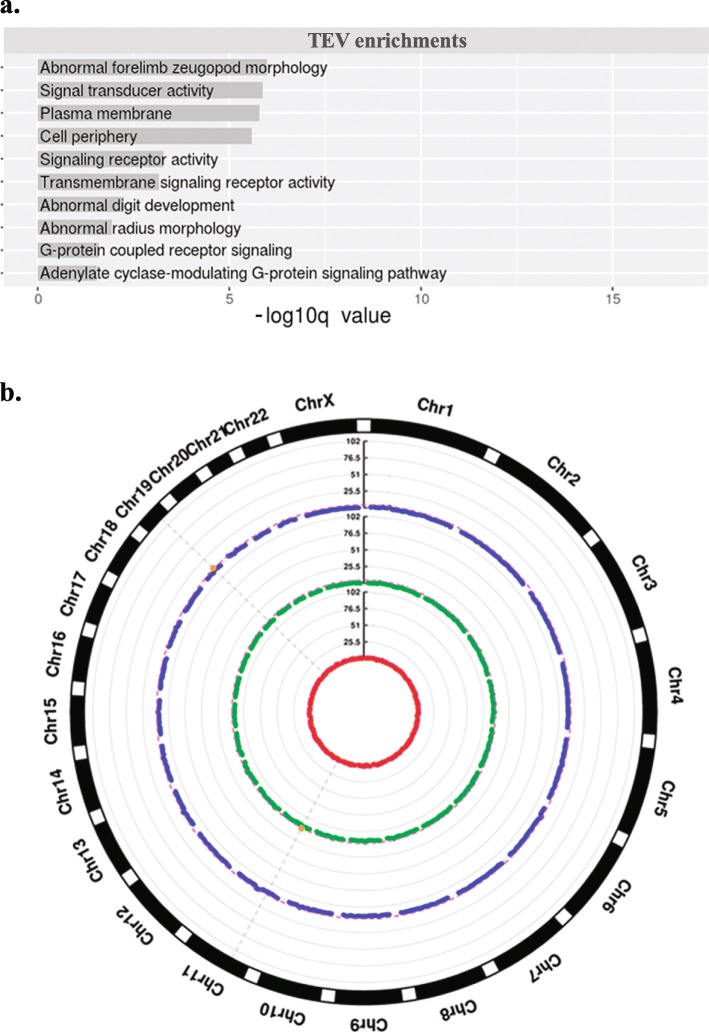
Fig. 1.
a. Functional enrichments related to all genes associated with TEVs against the whole genome. Enrichments are shown along with the FDR indicating the significance of the enrichments; b. Circular Manhattan plot representing genomic regions enriched in TEVs. Coordinates on the x-axis represent windows of 10 Mbp overlapping by 5 Mbp. On the y-axis the significance is reported as the negative log10 of the p-value from the randomization analysis for Alus (red), SVAs (blue), L1 s (green). Regions putatively enriched in TEVs (chr11:35000000–45,000,000 and chr19:35000000–45,000,000) are represented by orange dots, above the significance line (FDR = 0.05)

