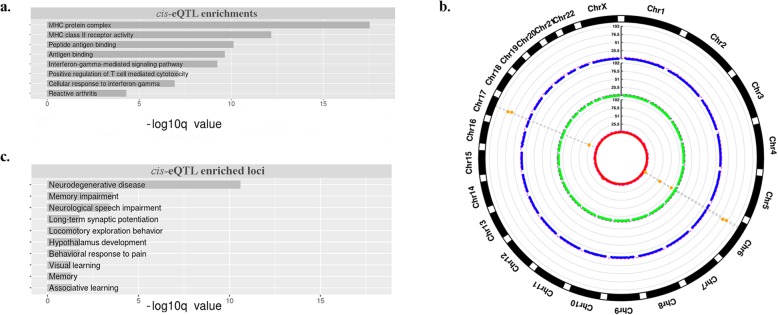
Fig. 2.
a. Functional enrichments related to all genes associated with TEV-cis-eQTL against all TEVs, enrichments are shown along with the FDR indicating the significance of the enrichments related to all genes associated with TEV-cis-eQTL against all TEVs; b. Circular Manhattan plot representing genomic regions enriched in TEVs-cis-eQTLs. Coordinates on the x- axis represent windows of 10 Mbp overlapping by 5 Mbp, while the negative log10 of the p-value associated to the TEV-cis-eQTL enrichments within each 10 Mbp window is plotted on the y-axis for Alus (red), SVAs (blue), L1 s (green). Regions putatively enriched are represented by orange dots, above the significance line (FDR = 0.05); c. Functional enrichments related to genes found in the two loci enriched in TEV-cis-eQTL (6p21.32 and 17q21.31). Enrichments are shown along with the FDR indicating the significance value

