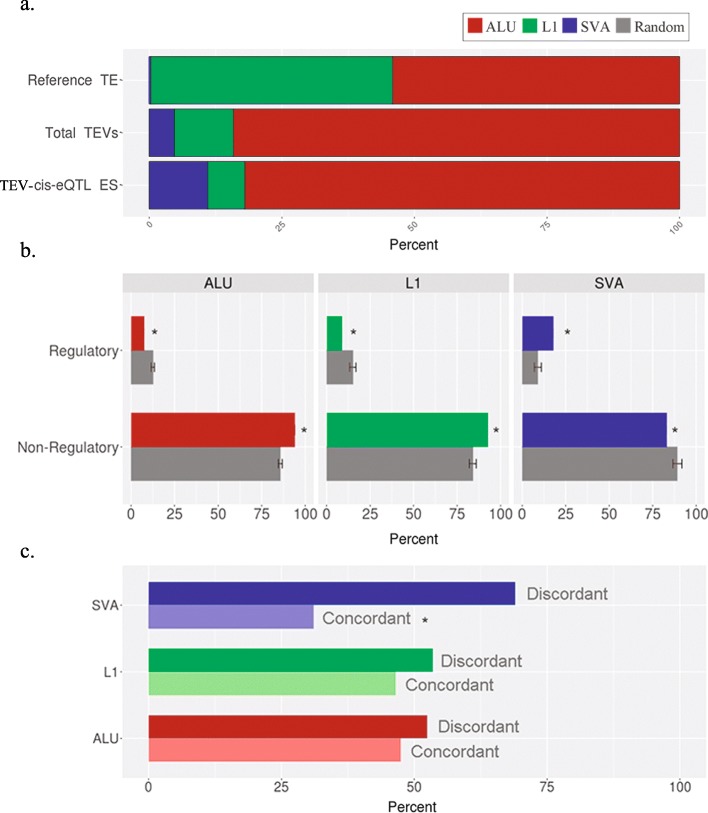
Fig. 4.
a. Percentage distribution of the three classes of TE in the reference genome, among all TEVs and among TEV-cis-eQTLs; b. percentage of TEVs overlapping regulatory and non-regulatory regions against random distributions (*Z-score < − 3, > 3); c. percentage of intra-genic TEVs on the same and opposite strand with respect to the transcribed strand for each class of TEVs (Fisher test, p < 0.00001)

