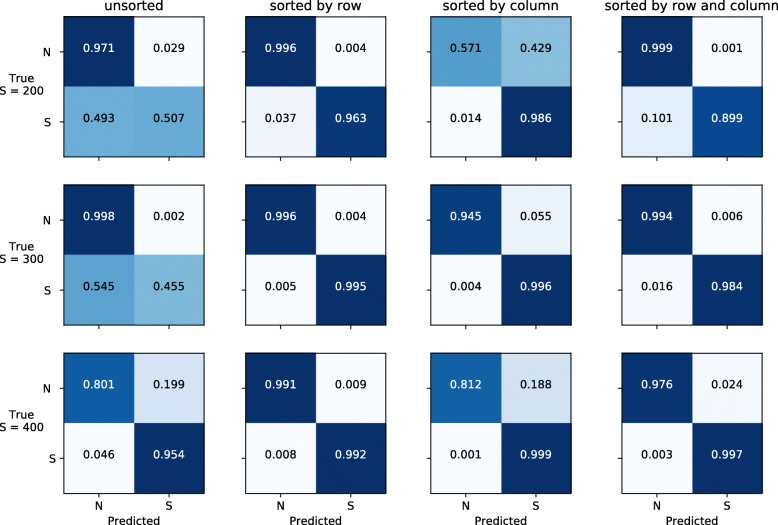
Fig. 3.
Accuracy of detecting positive selection using images with different sorting conditions. For each tested strength of positive selection (S={200,300,400}) we report the confusion matrices for predicting whether a genomic region is under neutrality (N) or selection (S) when images have been sorted with different conditions

