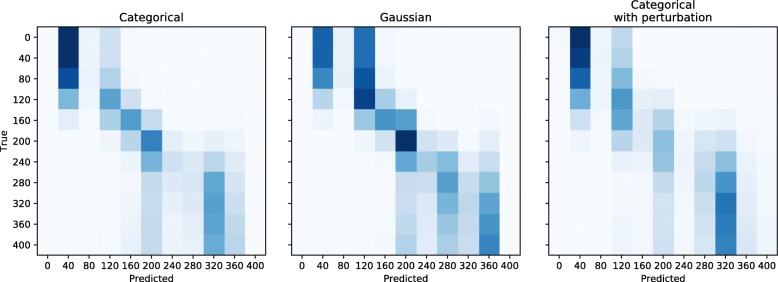
Fig. 5.
Accuracy of quantifying positive selection under different representation of the distribution of true labels. Confusion matrices for estimating selection coefficients into 11 intervals from 0 to 400. Classification was performed assuming a different representation of true labels, either as a categorical distribution, a Guassian distribution, or a perturbed categorical distribution

