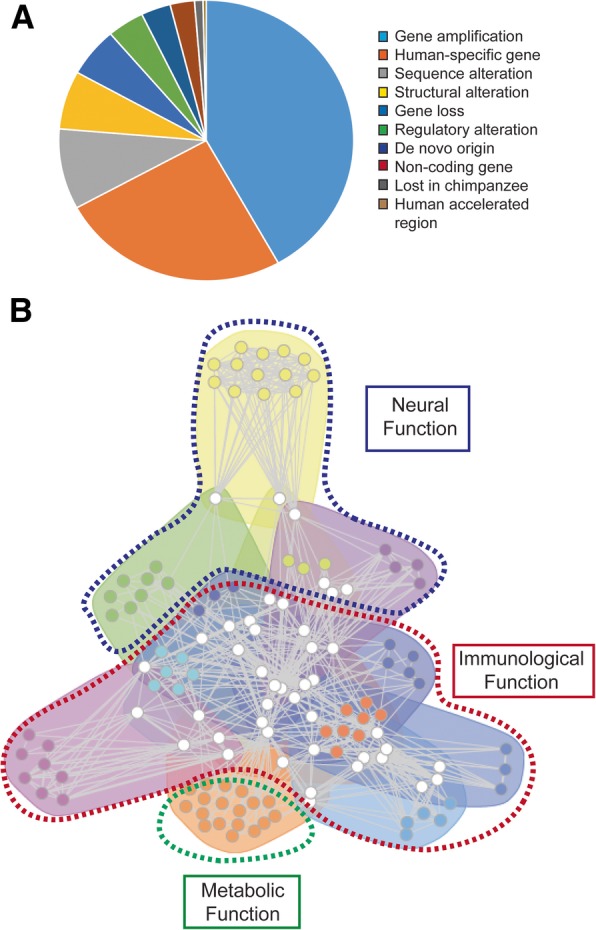
Fig. 1.

a The pie chart illustrates the distribution of 845 genes with human-specific features with regards to the underlying mechanism from which they originated. A more specific classification is shown in the Additional Table 1, as well as additional information for each gene. b Functional network of metagroups defined by GeneTerm Linker, represented with FGNet. The 23 metagroups were filtered to allow visualization of metagroups comprising functional terms at organism level and omitting metagroups describing broad cell-level or molecular-level characteristics, which can be assessed from Additional Fig. 1. The color scheme was maintained in all networks to allow comparison
