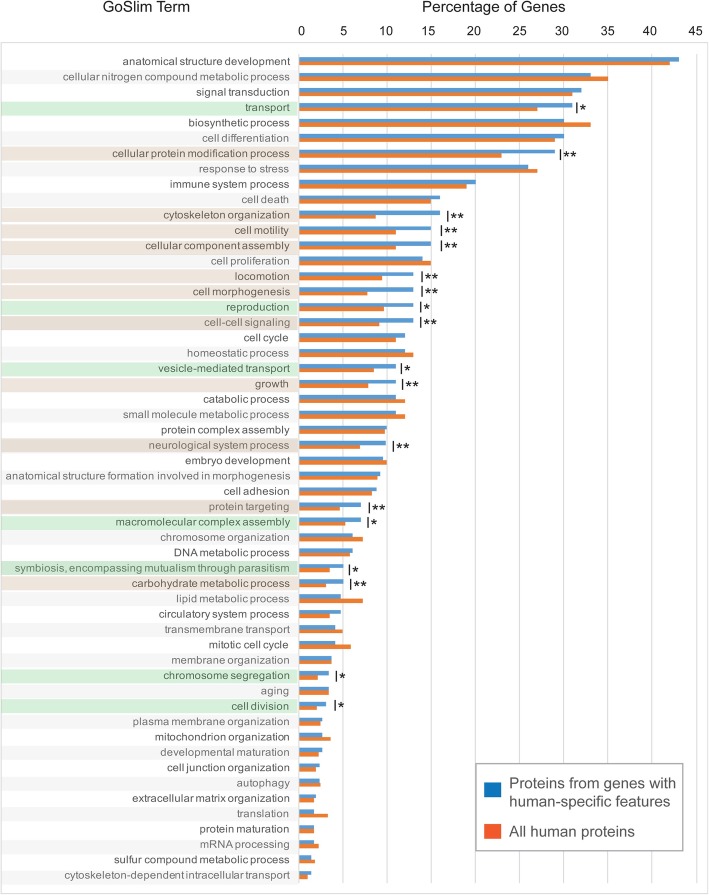
Fig. 2.
Evidence for enrichment of different gene ontology (GO) terms within the set of genes with human-specific features. Blue bars represent the percentage of genes with human-specific features for which at least one protein product has been associated to a specific GO term. Red bars represent this percentage at the gene level for the entire set of human proteins. Statistical significance of each differentially represented term was assessed using a Fisher exact test. Significant p-values are indicated (*p-value ≤0.1; **p-value ≤0.05) and the correspondent term is highlighted in green or brown, respectively

