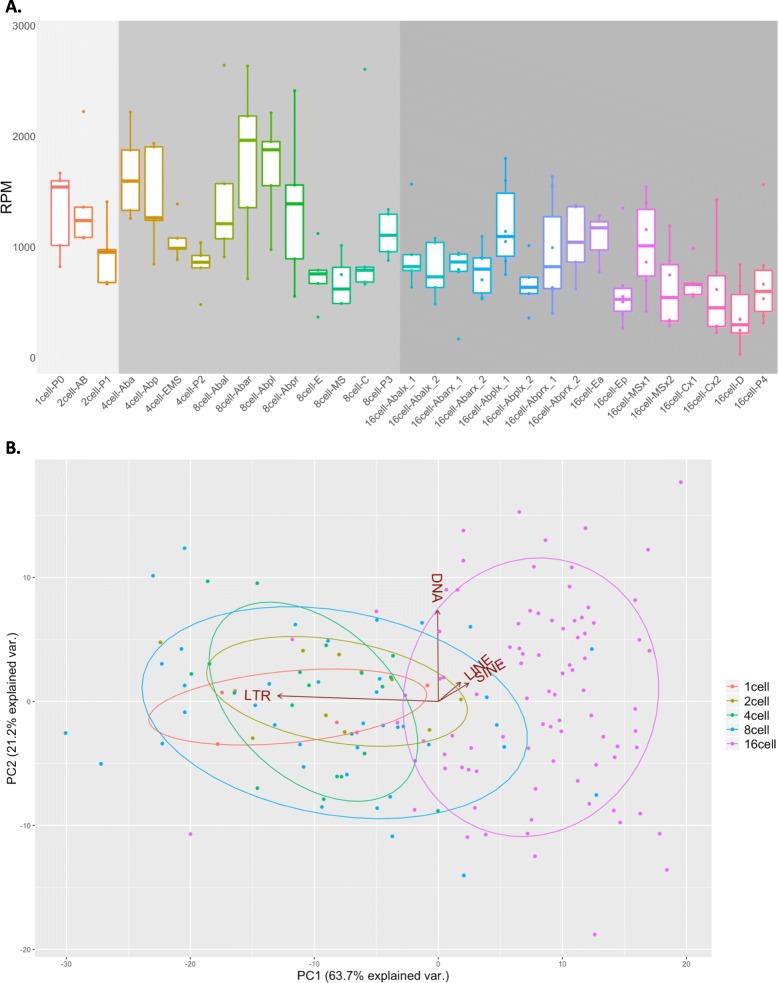
Fig. 2.
TE global expression profile among the 31 C. elegans early embryo cell types. a For each analyzed TE, raw read counts have been summed, converted in RPM (y-axis) and plotted for all the 31 C. elegans early embryo cell types (x-axis). Cells belonging to 1- and 2-cell stages (light grey background) are transcriptionally inactive and show, together with cells of the 4- and 8-cell stages (grey background), the highest levels of TE expression. TE expression levels decrease in the 16-cell stage (dark grey background) where embryo cell fate starts to be determined. b PCA analysis showing the distribution of all the 164 analyzed samples according to their TE expression. The samples can be subdivided in 2 main groups according to their TE expression profiles. The first one is composed by samples belonging mainly to 1-, 2-, 4- and 8-cell stages while the second group is composed by samples belonging to 16-cell stage. LTR expression determines the grouping of 1-, 2-, 4-, 8-cell stages, while non-LTR retrotransposons (SINE and LINE) expression determines the separation of 16-cell stage from the other cell stages. The variance explained by the first two principal components is 63.7 and 21.2% respectively. Three PCs make up 93%, four PCs make up 100% of the TE expression variation

