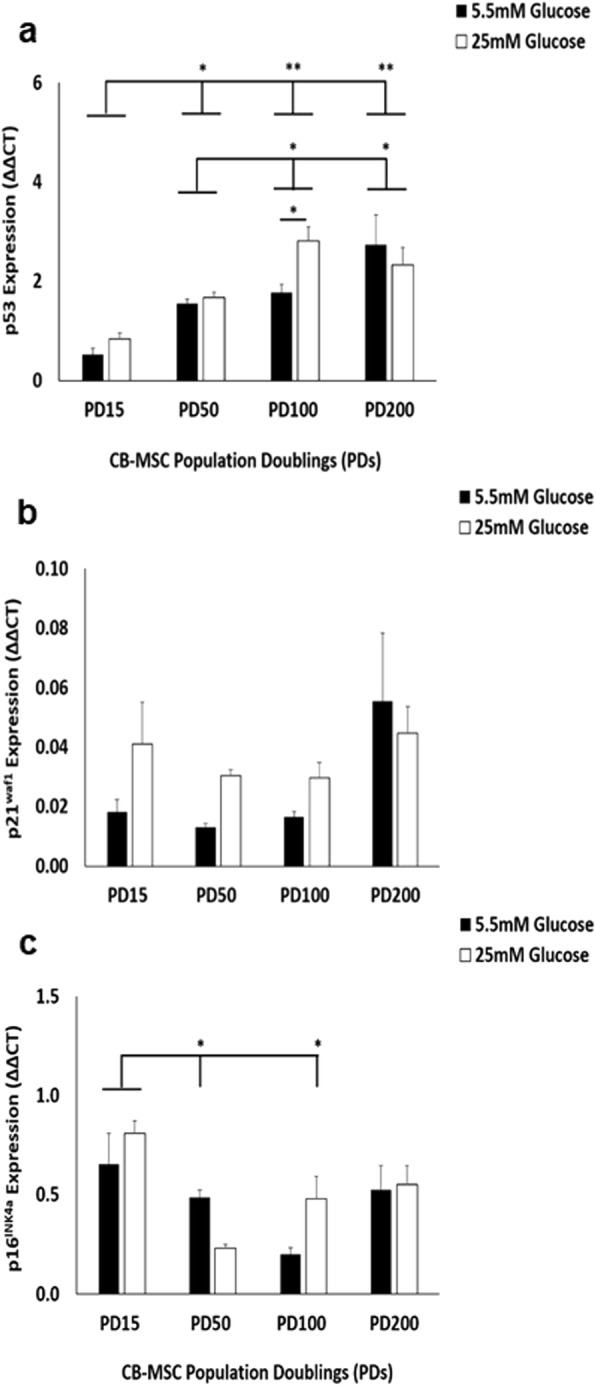
Fig. 3.

Characterisation of CB-MSC senescence marker (p53, p21waf1 and p16INK4a) expression under normoglycaemic and hyperglycaemic conditions. a Significant differences in p53 gene expression were shown between PD15 and PD50, PD100 and PD200 under normoglycaemic and hyperglycaemic conditions. However, only CB-MSCs at PD100 demonstrated significant higher p53 expression in high glucose, compared to normal glucose conditions. b p21waf1 exhibited very low expression, with no significant differences in expression between normoglycaemic and hyperglycaemic conditions. c p16INK4A expression was low across all PDs, although CB-MSCs at PD15 under both normoglycaemic and hyperglycaemic conditions demonstrated highest p16INK4A expression, which declined by PD50 onwards. Significance between CB-MSC populations are shown, **p < 0.01, *p < 0.05
