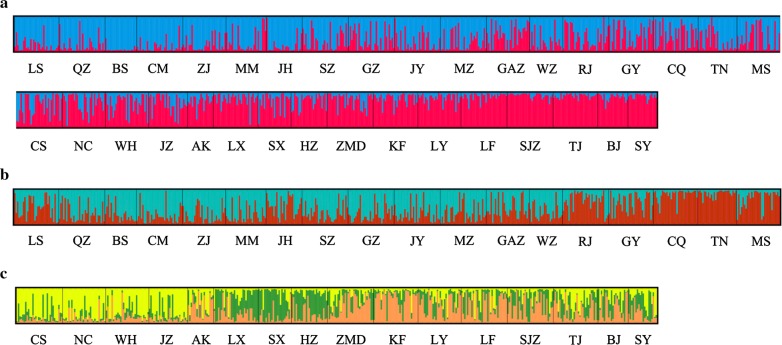
Fig. 2.
Genetic structure of Ae. albopictus within 34 locations. Each vertical bar in the plots represents an individual sample and each color represents a cluster, where the color of the bar indicates the probability of assignment to each of K optimal clusters (different colors) determined using Evanno et al.’s ΔK methods. a K = 2 for all populations. b K = 2 for 18 populations in southern and western areas. c K = 3 for 16 populations in central, eastern, and northern areas

