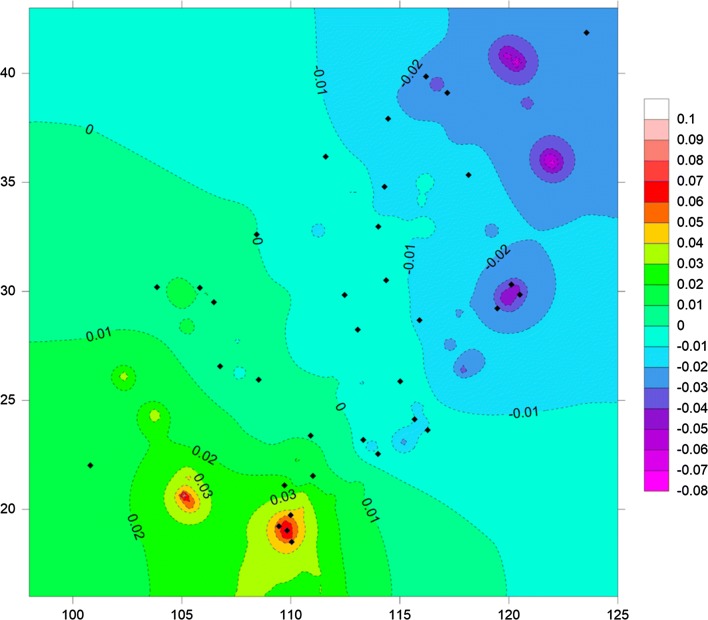
Fig. 4.
Genetic landscape shape plot showing patterns of spatial genetic distance for 34 populations of Ae. albopictus. The GLS interpolation analysis is shown in Surfer software, where X- and Y-axes correspond to geographical locations and the different colors of image regions represent genetic distances

