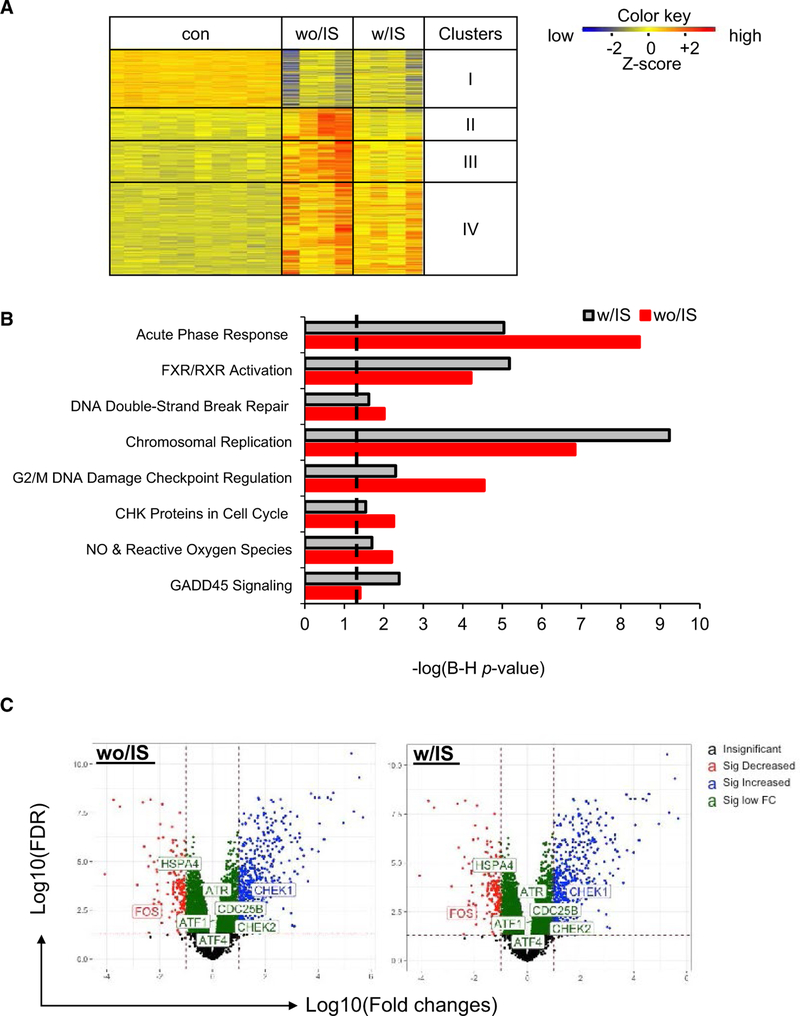
FIGURE 4.
Transcriptome profiling on kidney allografts. Kidney tissues or plasma samples were collected from D+-to-R− kidney allografts treated with immunosuppression (IS) (w/IS) or without IS (wo/IS) at the indicated endpoints. The contralateral latent donor kidney (con) was recovered at the time of the transplant (postoperative [POD]0). Pathways with –log P value >1.3 (dashed line) are statistically significant. A, Heat-map of deferentially expressed genes (DGF) in the kidney allografts (n > 4/group) at 48 hours posttransplant and clustered based on the expression levels. B, Ingenuity pathway analysis of selected genes in cluster IV (heat-map). C, Volcano plot showing changes of genes associated with DNA damage pathways in the transplants either wo/IS (left) and w/IS (right)

