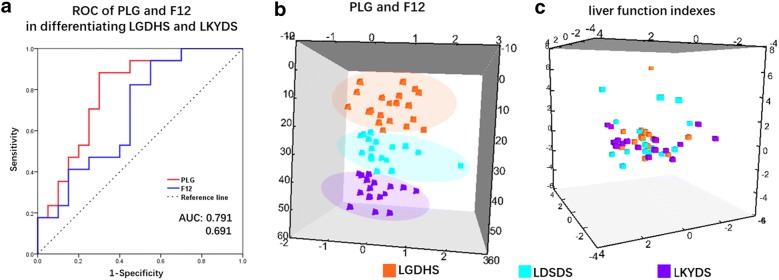
Fig. 6.
Diagnostic ability assessment for PLG, F12, and liver function indexes. a Receiver operating characteristic (ROC) ROC curve analysis of PLG and F12. AUC of PLG = 0.795 (95% CI 0.644 to 0.938), AUC of F12 = 0.795 (95% CI 0.520 to 0.862). b PCA of 57 samples including 20 LGDHS, 20 LDSDS and 17 LKYDS in an independent cohort by PLG and F12. c PCA of samples by liver function indexes (i.e. GGT, ALB, TBIL, DBIL, GLO, AST, ALT, TP, and ALP). Purple, LGDHS; orange, LKYDS

