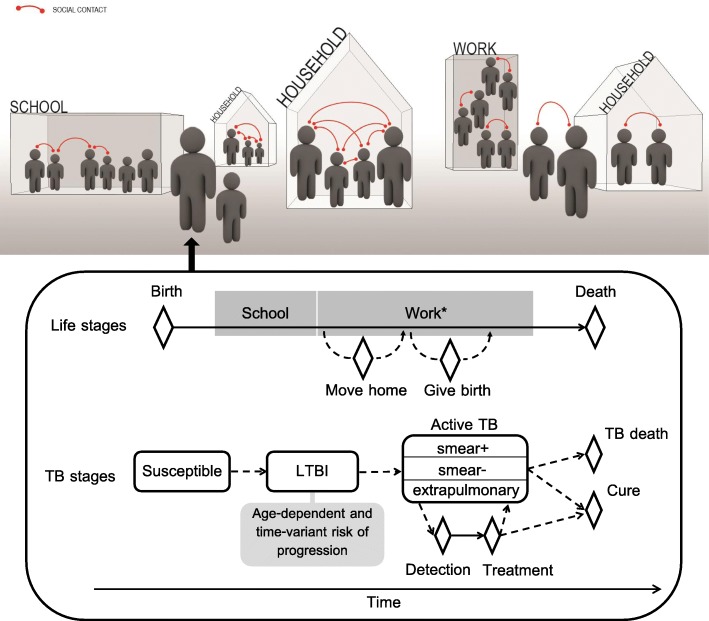
Fig. 1.
Schematic illustration of the agent-based model. The upper panel represents the structure of the simulated population and the diverse types of contacts simulated (household, school, workplace, other location). The lower panel illustrates individuals’ progression through the various stages of life and infection/disease using diamonds to represent events and boxes for extended phases. Solid arrows indicate deterministic progressions that occur in all surviving individuals, while dashed arrows represent possible but not universal progressions. *Only a fraction of the individuals enters the organised workforce

