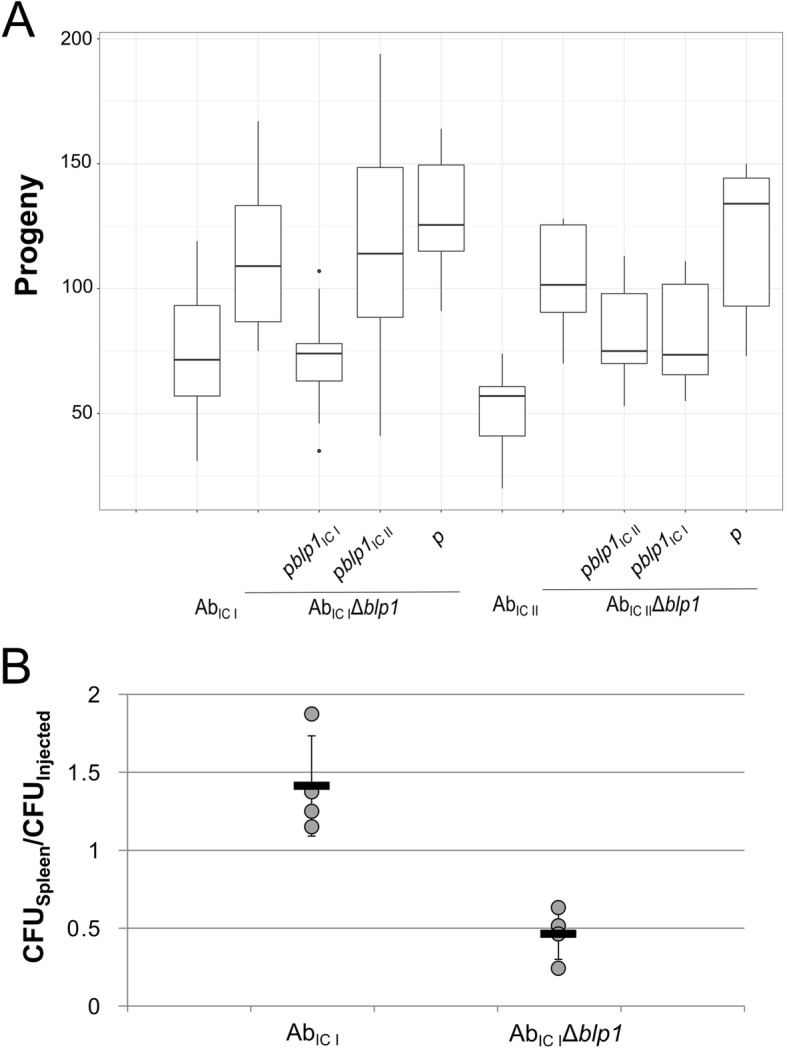
Fig. 4.

A. baumannii virulence in animal infection models. a – C. elegans fertility was evaluated after 3 days of nematodes growth in the presence of A. baumannii bacteria on NGM plates; box plot represents the count of nematodes progeny after incubation; data are given from at least two independent experiments, three plates were used in the each experiment; black lines represent medians and whiskers – minimum to maximum values. b – mice sepsis infection model represented as relative amount of A. baumannii CFUs in the spleens from BALB/c mice 6 h after infection compared to the injected amount of total CFUs (n = 4 mice per group); mice were intraperitoneally infected with 4 × 10⁵ CFU and 9.5 × 10⁵ CFU of AbIC I and AbIC IΔblp1, respectively; each dot represents one mouse, black lines indicate averages, whiskers represent standard deviations
