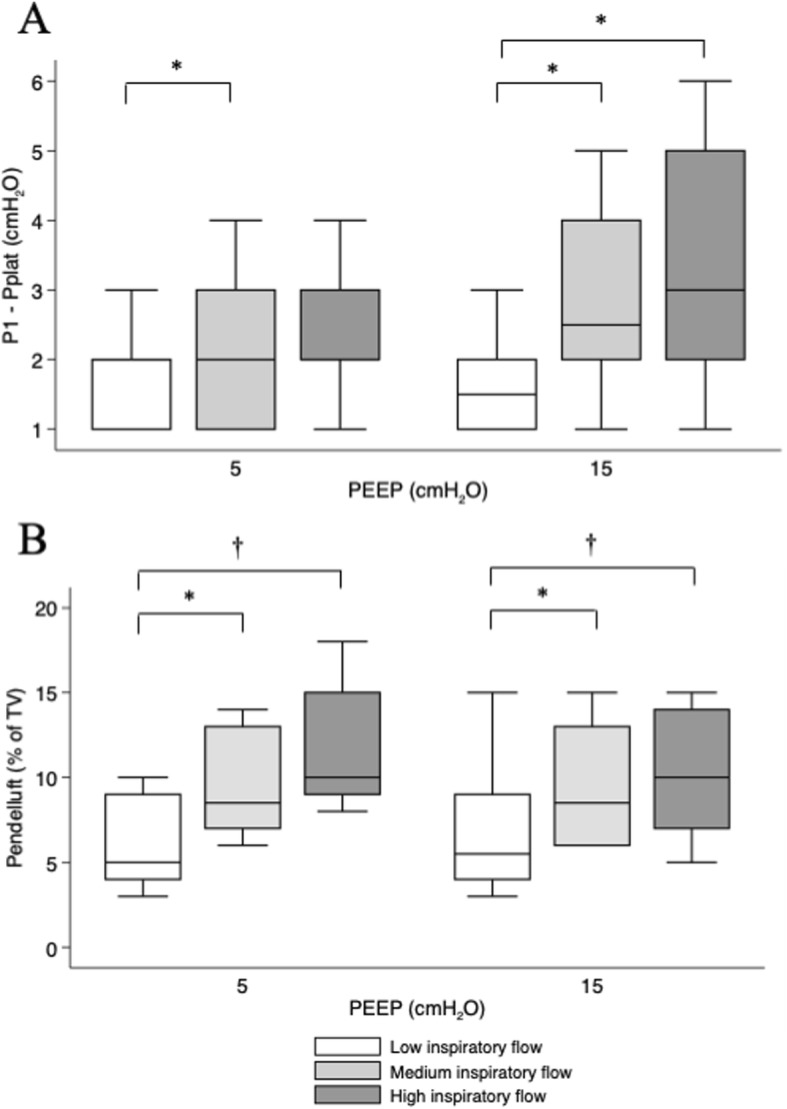
Fig. 2.

Flow and PEEP effect on additional inspiratory pressure and pendelluft. Box plot of additional flow-dependent pressure (measured as P1 − Pplat, a) and pendelluft (b) at the different combinations of PEEP (5 and 15 cmH2O) and inspiratory flow (400, 800, and 1200 ml/s; white, light gray, and dark gray, respectively). a p < 0.001 for flow effect, p = 0.168 for PEEP effect; b p < 0.001 for flow effect, p = 0.676 for PEEP effect; two-way repeated-measures ANOVA. *p < 0.05 within PEEP; †p < 0.01 within PEEP
