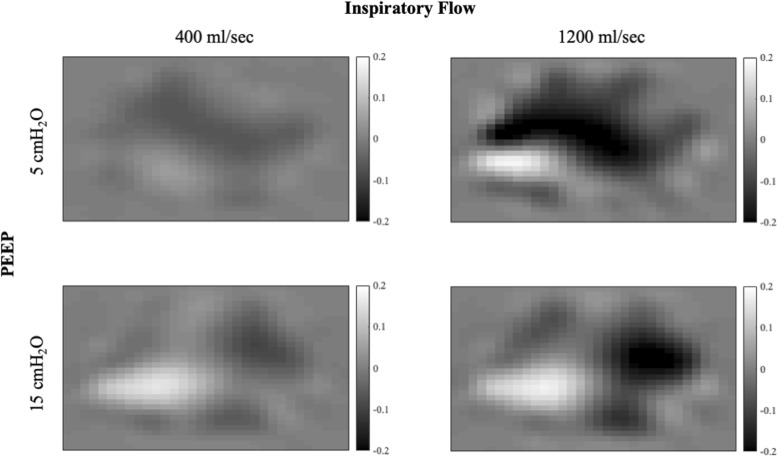
Fig. 3.
Pendelluft at end-inspiration. Pendelluft occurring at end-inspiration at PEEP 5 cmH2O (upper panels) and 15 cmH2O (lower panels) at low (left panels) and high (right panels) inspiratory flow in a representative patient. Pendelluft was calculated from the pixel-by-pixel difference between EIT-derived aeration at Pplat and P1 (see text for details). Each pixel was color-coded based on the amount of gas in milliliters entering (white) or leaving (black) the pixel. The color bar is provided on the right-hand side of each panel

