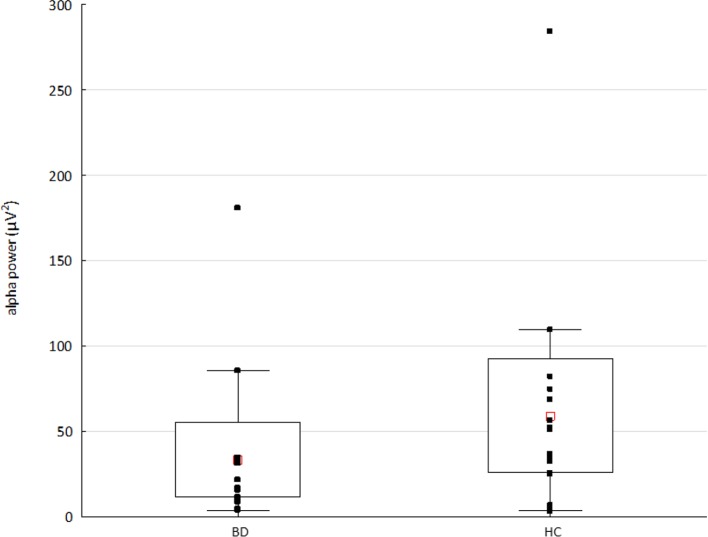
Figure 3.
The alpha power in patients with bipolar disorder (BD) and healthy controls (HC). Raw data are plotted on top of each boxplot showing the mean (▪), 95% confidence interval (box plot area), and non-outlier range (whiskers). The x-axis represents the subject group; the y-axis represents the average alpha (8–14 Hz) power across 204 channels. Note significantly decreased alpha power in the BD compared to HC group (p < 0.03, Z value 2.7).

