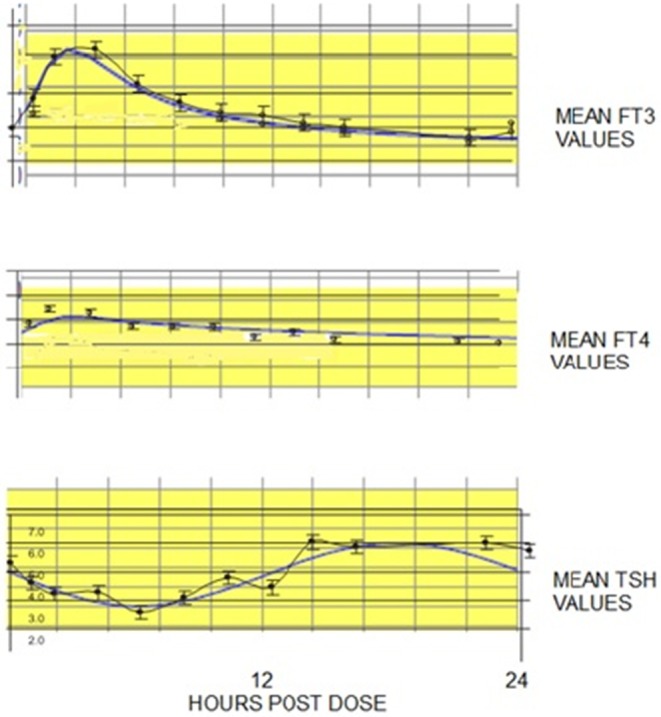
Figure 2.

FT3, FT4, and TSH 24 h temporal responses (blue curves) predicted by THYROSIM for simulated 117 μg T4 + 10 μg T3 dosing, superimposed over corresponding LT3, LT4, and TSH data (black dots with error bars) collected over 24 h, in 10 patients from a larger study in hypothyroid patients on combined LT3/LT4 therapy (18–34). Yellow bands represent normal ranges.
