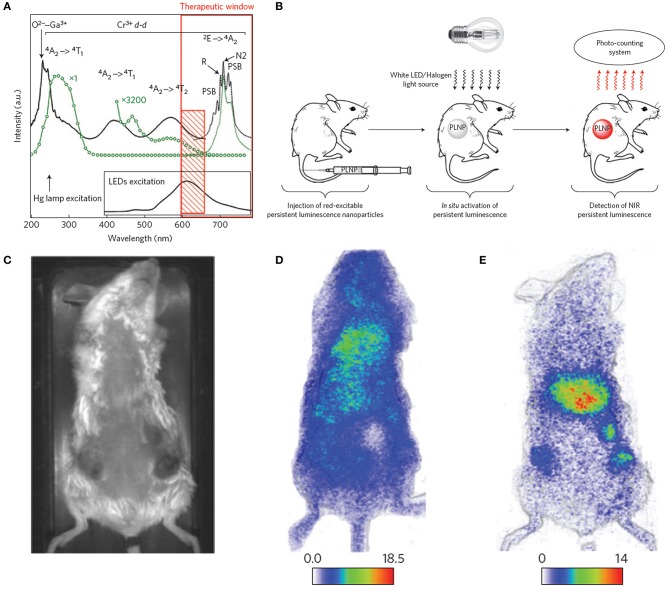
Figure 2.
(A) Photoluminescence excitation (black solid line) and emission (black dotted line) spectra of Cr3+ doped n-ZGO. (B) Schematic representation of in vivo imaging after in situ activation of persistent luminescence nanoparticles (PLNPs). (C) Optical image of a tumor-bearing mouse. (D) Persistent luminescence image of a tumor-bearing mouse 2 h after injection of ZGO-PEG NPs. (E) Persistent luminescence image of a tumor-bearing mouse immediately after LED illumination, 4 h after injection of ZGO-PEG NPs.

