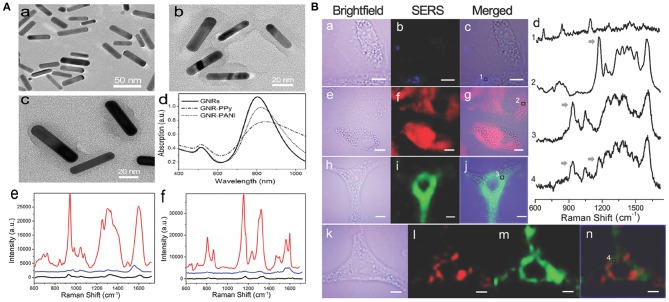
Figure 3.
(A) Characterization of SERS nanoprobes: (a–c) TEM images of GNRs, GNR-PANI, and GNR-PPy, respectively. (d) UV-vis-NIR absorbance spectra of the nanostructures. Raman spectra of GNR-PPy (e) and GNR-PANI (f) under 785 nm (red line) and 514.5 nm (blue line) laser excitation, respectively. Black lines show the normal Raman spectra of CP molecules. (B) NIR SERS imaging of A549 cells after incubation with GNRs (a–c), GNR-PANI (e–g), and GNR-PPy (h–j) for 4 h. (d) Raman spectra in the cytoplasmic compartments. Arrows indicate the Raman peaks used for SERS imaging. (k–n) Two-color imaging after incubation with a mixture of two tags [brightfield image (k), GNR-PANI (l), GNR-PPy (m), merged image (n)].

