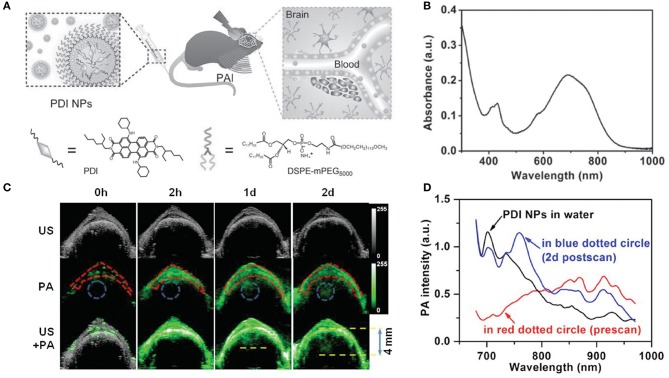
Figure 4.
(A) Schematic illustration of the PA imaging process of brain tumor in vivo by PDI NPs. (B) UV-vis-NIR absorption spectrum of PDI NPs in aqueous solution. (C) Ultrasonic (gray), photoacoustic (green), and their overlay brain coronal sections of the tumor model after tail vein injection of PDI NPs. (D) PA spectra of PDI NPs in different media. Skull region in the red dotted circle of (C) before NP injection (red line) and tumor region in the blue dotted circle of (C) after 2 d NP injection (blue line).

