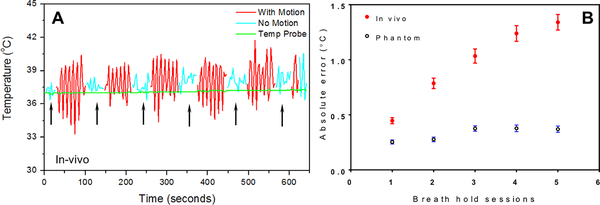
Fig.6.
The breath-hold sessions during in vivo 10 minutes hyperthermia treatment (A, black arrows) and the MR thermometry absolute error for each session (B). The error changed as a function of time with bars represent mean ± SEM across all experiments (n = 6 for phantom, n = 12 for in vivo). The graph suggests the absolute error tends to increase over time and the change was more pronounced in the pig study than that in phantom.

