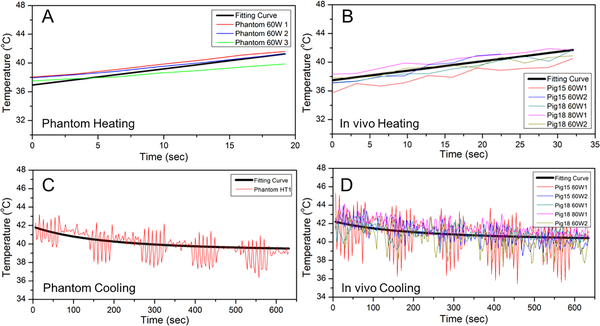
Fig.8.
The fitting curve for heating and cooling period in phantom and pig experiment. The black thick line is the overall fitting curve across all datasets, whereas the thin colored curves are raw temperature measurements from MR thermometry. A, B and C, D are for heating and cooling period respectively. The fitting coefficients were acquired based on the accurate temperature measurements during breath hold.

