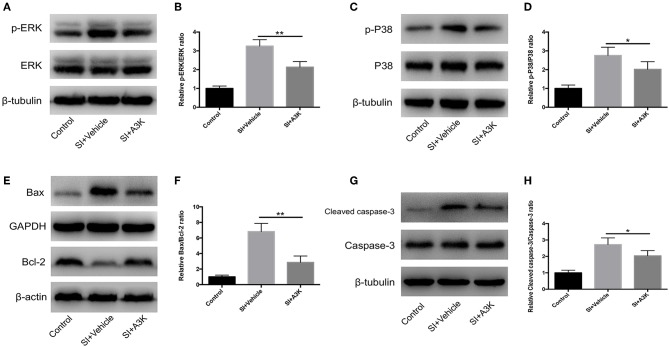
Figure 8.
Serpina3k regulated MAPK and mitochondrial apoptosis pathways after experimental SI in SH-SY5Y cells. Representative western blots of p-ERK and ERK (A), p-P38 and P38 (C), Bax and Bcl-2 (E), and cleaved caspase-3 and caspase-3 (G). Quantified bar graphs of p-ERK/ERK (B), p-P38/P38 (D), Bax/Bcl-2 (F), and cleaved caspase-3/caspase-3 (H) ratios at 2 h after SI in the control, SI+vehicle, and SI+A3K groups. β-tubulin, GAPDH, and β-actin were used as loading and internal controls. Data represent the mean ± SD (n = 5 per group). *P <0.05, **P <0.01, SI+A3K vs. SI+vehicle group.

