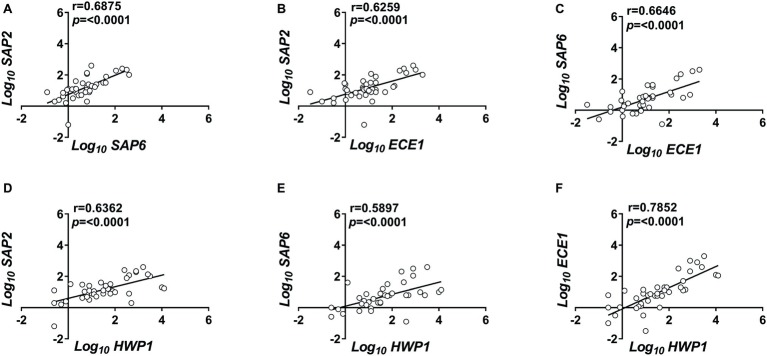
Figure 1.
Correlated expression of C. albicans genes. Vaginal samples of symptomatic women were centrifuged at 3,000 rpm for 10 min, then cellular fractions were lysed, and total RNA was extracted and retro-transcribed to cDNA. (A–F) The expression levels of SAP2, SAP6, ECE1, and HWP1 genes were calculated by comparative Ct method (2−∆Ct formula) after normalization with ACT1 gene. The results reported are from triplicates samples from 40 VVC subjects. Linear regression lines are shown. Pearson correlation (r) and statistical significance are indicated in each panel.

