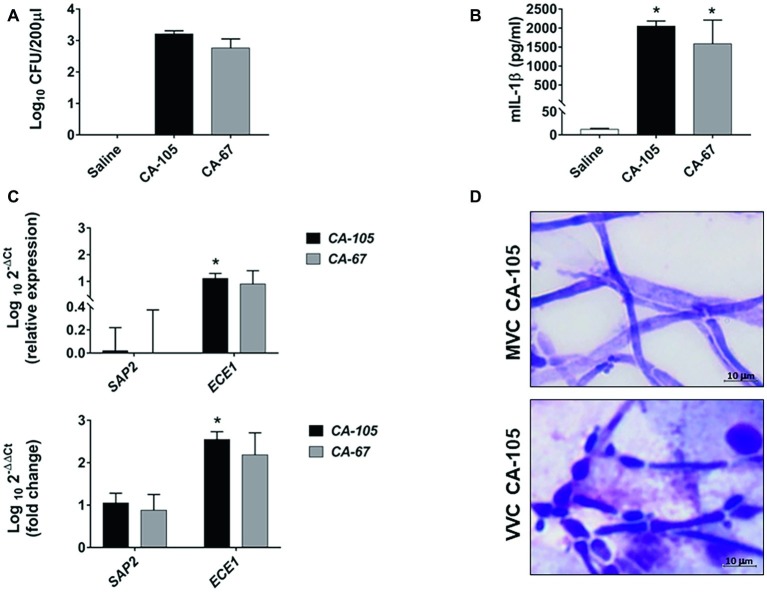
Figure 4.
Fungal burden, cytokine production, SAP2 and ECE1 gene expression, and C. albicans morphology in CD1 mice. Panels (A,B) CD1 female mice were infected with two clinical isolates of C. albicans (CA-105 and CA-67). Vaginal swab was taken from each mouse 3 days post-infection. Fungal burden was evaluated by CFU counts (A), while IL-1β production was quantified by ELISA (B). Data are from one experiment with n = 3 mice/group. The graphs show the mean ± SEM and statistical significance was evaluated with ANOVA test + Bonferroni. *p < 0.05 infected mice vs. uninfected mice. Panel (C) The cellular fractions from the vaginal swab were lysed, and total RNA was extracted and immediately retro-transcribed into cDNA. SAP2 and ECE1 genes were detected as described in “Materials and Methods” section. All samples were measured in triplicates and amplified cDNA quantities reported as 2−ΔΔCt relative to the Candida at day 0 (inoculum) (graph below) or as 2−ΔCt fold expression (graph above). Data for SAP2 and ECE1 genes are the mean ± SEM from one experiment with n = 3 mice/group, and statistical significance was evaluated with Student t test. *p < 0.05 SAP2 vs. ECE1 expression. Panel (D) Comparative images of CA-105 morphology in MVC (above) and in VVC (below) are shown (original magnification 1,000×, scale bar = 10 μm).

