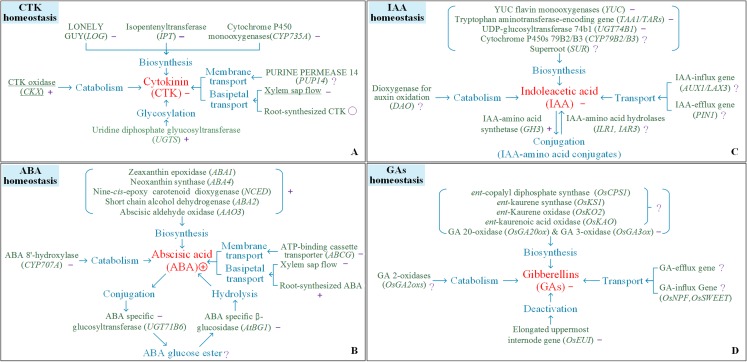
Figure 4. Response of processes involving the homeostasis of cytokinin, indole-3-acetic acid, abscisic acid, and gibberellin.
(A) CTK homeostasis, (B) IAA homeostasis, (C) ABA homeostasis, (D) GAs homeostasis. The symbols +, −, Ο, and ? indicate an increase, a decrease, steadiness, and an undefined response, respectively, for a certain trait or process in response to heat conditions.

