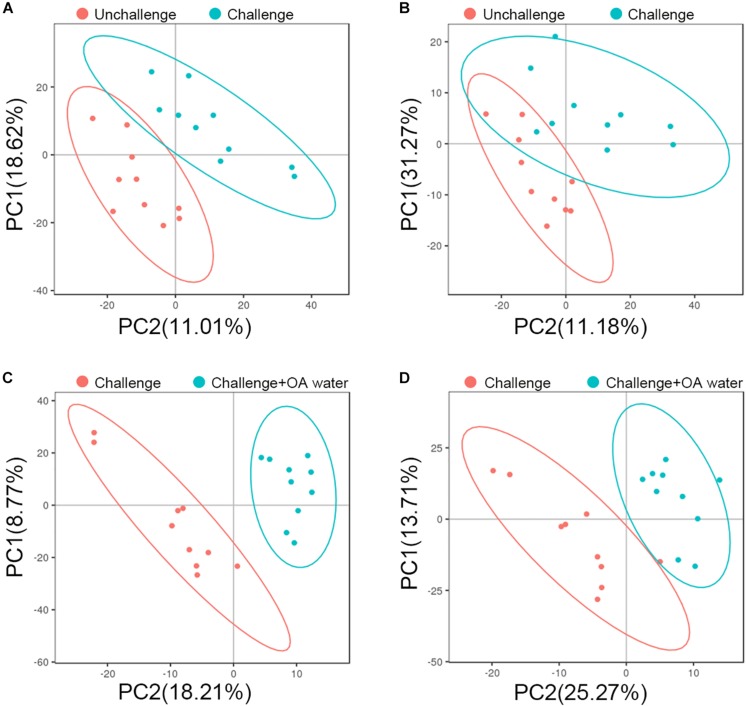
FIGURE 1.
PLS-DA score plots based on data from LC-MS/MS analysis of plasma from the unchallenged control, challenged control, and the challenged group fed with organic acids in drinking water (challenge + OA water). (A,C) Score plots for the positive ion mode. (B,D) Score plots for the negative ion mode. In the score plot, each data point represents one bird plasma sample.

