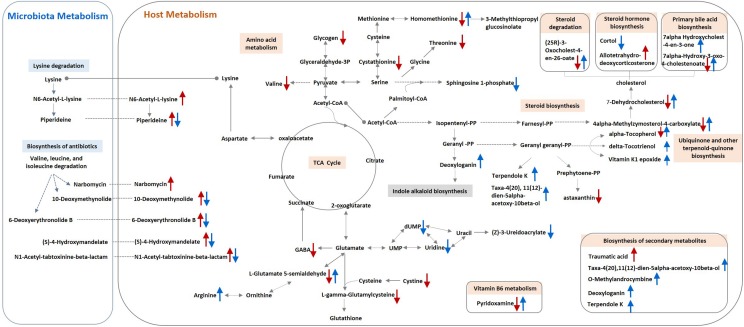
FIGURE 2.
Schematic model for metabolite changes due to S. Pullorum challenge and organic acids intervention in broilers. A single red arrow (↑/↓) indicates increased or decreased levels of metabolites in the S. Pullorum challenge control compared with the unchallenged control. A single blue arrow (↑/↓) indicates increased or decreased levels of metabolites in the challenged group fed with organic acid in drinking water compared with the challenge control.

