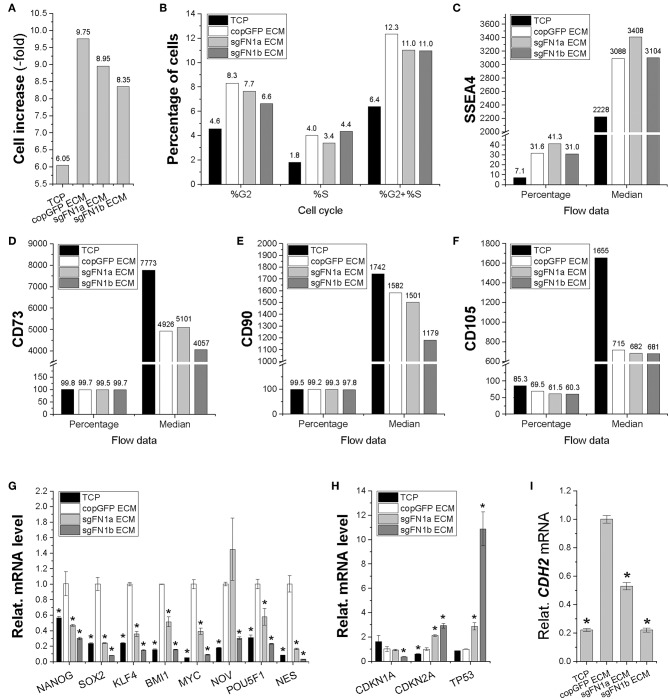
Figure 5.
Proliferation capacity of human IPFSCs after expansion on the dECMs deposited by FN1-KO cells. Passage 15 human IPFSCs were compared after expansion on dECMs deposited by Cas9-sgFN1a/b transduced cells (sgFN1a ECM and sgFN1b ECM, respectively) with those deposited by copGFP (copGFP ECM) and those grown on TCP (TCP) as controls in cell increase (A), percentage of cells in the S and G2 phases (B), and surface markers [SSEA4 (C), CD73 (D), CD90 (E), and CD105 (F)] by flow cytometry; stemness genes (NANOG, SOX2, KLF4, BMI1, MYC, NOV, POU5F1, and NES) (G), senescence genes (CDKN1A, CDKN2A, and TP53) (H), and the mesenchymal condensation gene (CDH2) (I) by qPCR. GAPDH was used as an endogenous control. Data are shown as bar charts. *indicates a significant difference compared to the corresponding copGFP group (P < 0.05).

