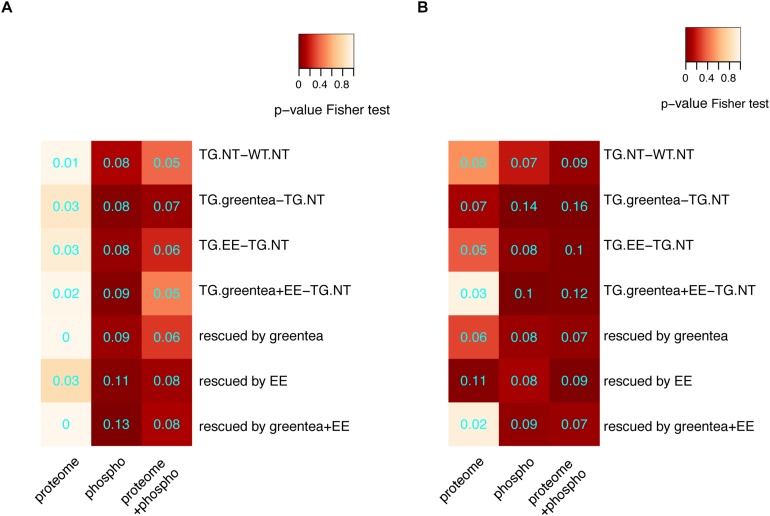
FIGURE 6.
Enrichment for DYRK1A interactors. (A) Heatmap showing the p-values (Fisher exact test) corresponding to the enrichment of DYRK1A interactors when considering the main contrasts and rescued proteins for proteomic data, phosphoproteomic data, or both lists merged. (B) The same as in A but with lists extended to the direct interactors. Overlap coefficients are printed in cyan.

