FIGURE 8.
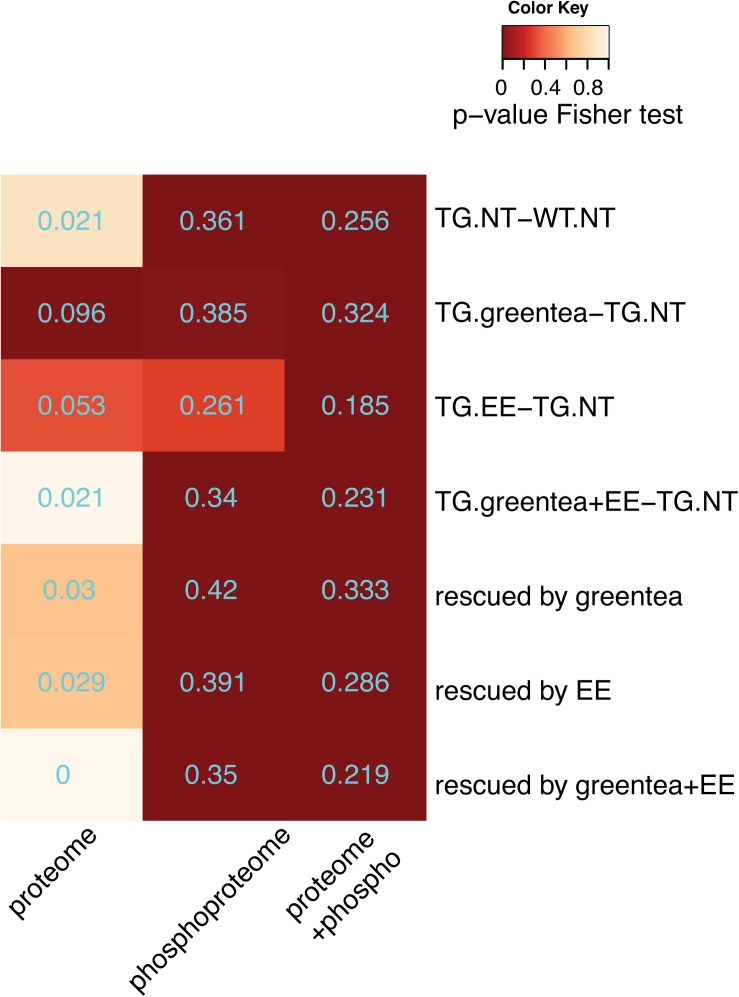
The effects of green tea extract, EE, and the combined treatment are genotype specific. (A) Venn diagram showing the overlap between proteins changing their abundance or their phosphopeptide levels upon any of the treatments in TG and wild-type mice. (B) Venn diagram showing the overlap between the (phospho-)proteins having the same behavior upon one of the treatments in TG mice and WT mice, and (phospho-)proteins exhibiting a genotype-specific response to treatments. (C) Plot comparing phosphopeptide (top panel) and protein (bottom panel) fold changes upon each of the three treatments in TG mice (x-axis), and wild-type mice (y-axis). Protein or phosphopeptides with a significant interaction in the contrast (TG.T-TG.NT) - (WT.T-WT.NT), where T stands for one of the treatments, and NT for “not treated,” are indicated as red dots.

