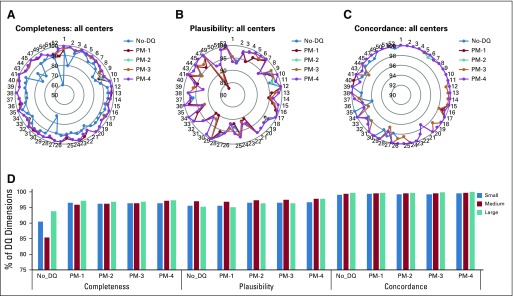
FIG 2.
Results of the data quality (DQ) assessment applied after each milestone. (A-C) Radial graphs of (A) the completeness, (B) the plausibility, and (C) the concordance indexes computed after each milestone for each center. (D) The same indexes represented by bar diagrams divided into small centers (< 5 patients enrolled), medium centers (5-9 patients enrolled), and large centers (≥ 10 patients enrolled). PM, post milestones.

