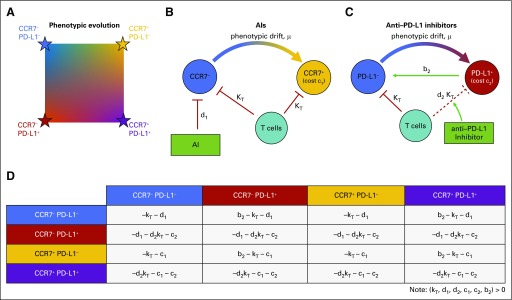
FIG 2.
Schematic of the mathematical model. (A) The tumor population consists of phenotypes varying on two axes: CCR7 (increasing from left to right) and PD-L1 (increasing from top to bottom). (B) Aromatase inhibitor (AI) therapy targets CCR7− phenotypes with kill rate of d1; these may evolve CCR7 expression due to selection. T cells kill both types at rate kT. (C) Checkpoint inhibitor therapy boosts the immune response against tumor cells expressing PD-L1. In addition, PD-L1− cells benefit from being near PD-L1+ cells, known as a “cheater” population. (D) The two-dimensional phenotypic space is modeled using a four-player game with subscript 1 indicating the CCR7 axis and subscript 2 indicating the PD-L1 axis. Killing terms (see red lines in 2B and 2C) for kT, d1, and d2 are added to PD-L1−, CCR7−, and PD-L1+ rows, respectively. Cost terms (c1, c2) are added to CCR7+ and PD-L1+ rows, respectively. The cheater benefit, b2, is added to PD-L1− interactions (row) with PD-L1+ cells (column). Note that all costs (c1, c2, kT, d1, d2) and benefits (b2) in payoff matrix A are constrained to non-negative values.

