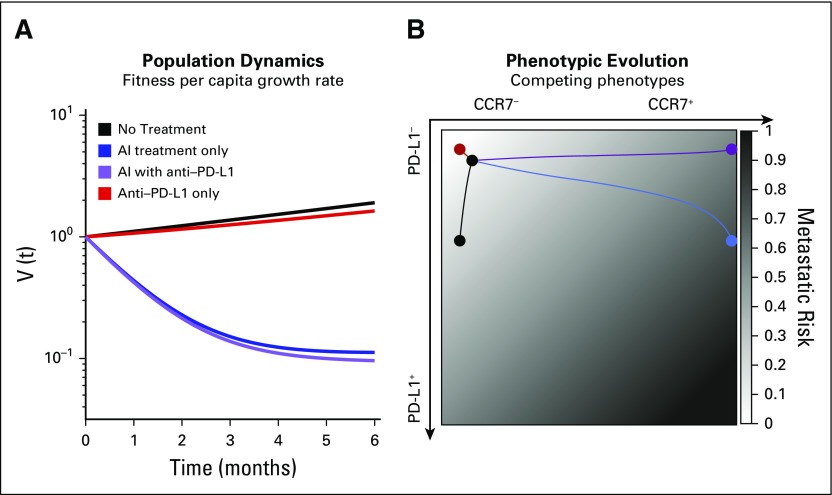
FIG 3.
Trade-off between metastatic risk and tumor regression. (A) Tumor regression is shown for no treatment (black), continuous aromatase inhibitor (AI; blue), continuous checkpoint inhibitor (red), and combined therapy (purple). (B) Trajectories on the metastatic risk simplex (white to black for increased risk) are also shown for the four scenarios. Treatments may be associated with optimal metastatic risk and worse regression (checkpoint inhibitor) or with optimal regression but worse metastatic risk (AI with checkpoint inhibitor). Baseline parameter values are as follow: c1 = c2 = b2 = f2 = 0.1; λ = 0.5; k = 0.4; d1 = 1.1; d2 = 0.95.

