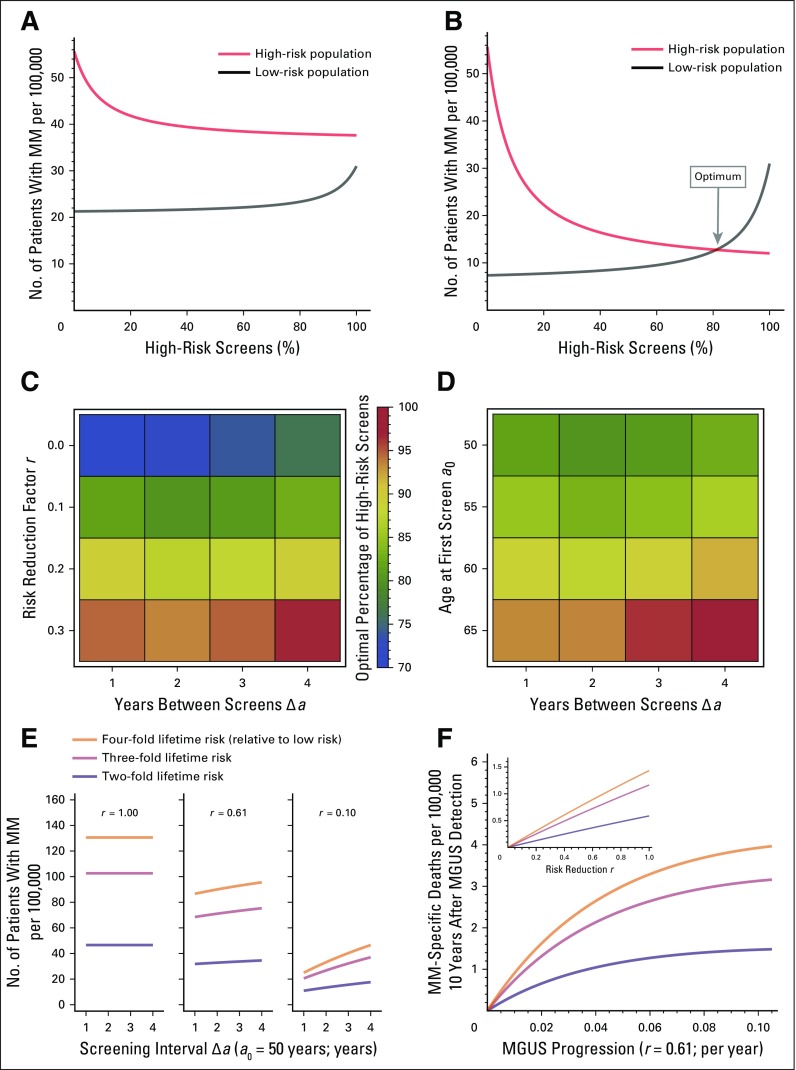
Fig 4.
Equal disease fractions as a criterion for optimal screening distribution. (A, B) Comparing multiple myeloma (MM) fractions in the high-risk and low-risk populations (men and women, respectively), with a0 = 50 years and Δa = 1 year, for different r. (A) For r = 0.61, equality could not be observed for any percentage of high-risk screens. (B) For r = 0.1, equality was observed at approximately 81% high-risk screens. Thus, an optimal fraction of screens was defined as the point where the fractions of patients with MM in both subpopulations were the same. (C) Location of the optimal fraction (scale) under variation of r and Δa (Table S5, Data Supplement), with a0 = 50 years. Changing r from 0 to 0.3 would lead to up to 20% change in the optimal high-risk fraction of screens. Changing Δa from 1 to 4 would lead to 1% to 3% change in the optimal high-risk fraction of screens. (D) For fixed r = 0.1, changes in a0 had more drastic effects than changes in Δa (Table S6, Data Supplement). (E) For risk groups with a lifetime risk higher than two-fold, we examined the effect of risk reduction and screening interval (a0 = 50 years) on the number of patients with MM (Data Supplement). (F) MM-specific deaths per 100,00 were calculated as the product of screened individuals with monoclonal gammopathy of undetermined significance (MGUS) at age 60 years and the 10-year follow-up MM-specific mortality (a0 = 50 years and Δa = 1; age at MGUS detection, 60 years). Both risk reduction and spacing of screens have more pronounced effects in higher-risk groups.

