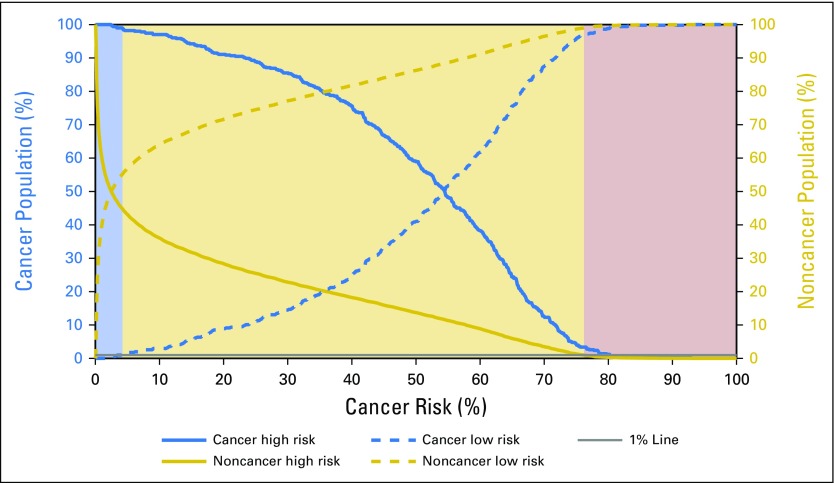
Fig 3.
Cumulative distribution function for the cancer and noncancer populations in the validation set as the thresholds for high and low risk are changed. With the assumption of a 1% misclassification rate in the low- and high-risk categories, the model divides individual cancer risk into three categories shown by the following shading scheme: high (purple), medium (tan), and low (blue).

