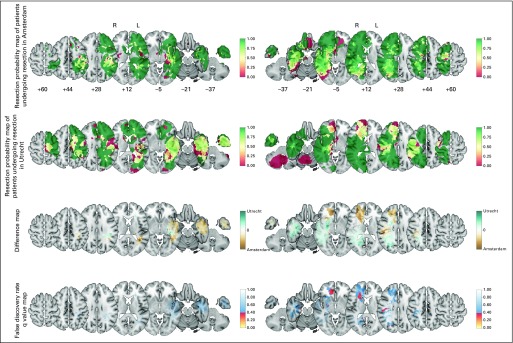
Fig 3.
The resection probability map comparison of 77 versus 68 patients undergoing resection per team to evaluate neurosurgical decision making on residual disease for the left (L; 28 v 32) and right (R) hemispheres (49 v 36). Note that the color code for resection probability in rows 1 and 2 is different from those in Figures 1 and 2. The color codes for difference maps in row 3, and false discovery rates in row 4 are identical in all figures. The Data Supplement provides the full results.

