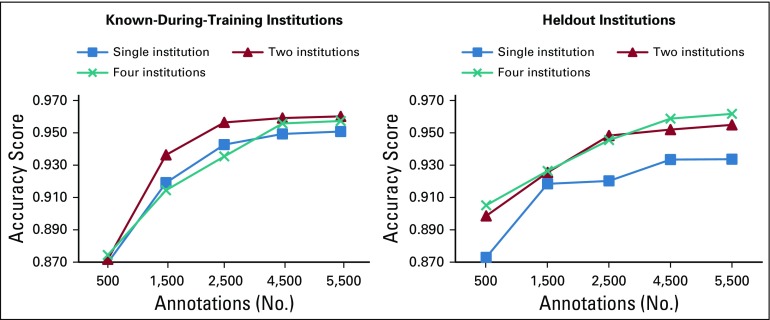
FIG 3.
Learning curves on data from both the known-during-training and the heldout institutions for the three settings. Accuracy scores represent the average across attributes for systems trained on 500, 1,500, 2,500, 4,500, and 5,500 annotations plus 500 annotations reserved for the validation set. The learning curve training sizes were determined a priori.

