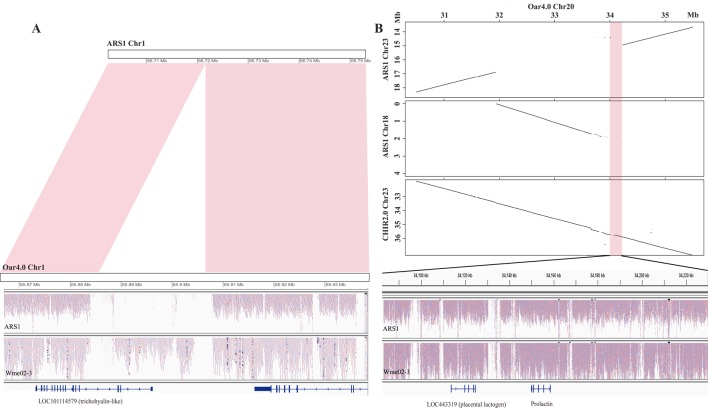
Figure 3.
The source of pan-sequences. (A) An example of pan-sequences resulting from insertions. A region of 18.8 kb was found to be present in goat by comparing Oar4.0 with ARS1 which was supported by reads mapping information. (B) An example of pan-sequences resulting from assembly errors in ARS1. The dot plots showed a region of 148 kb identified from chr20 of Oar4.0 that was missing in chr23 of ARS1. The presence of this region was supported by synteny with chr23 of CHIR2.0 and by the reads mapping information.

