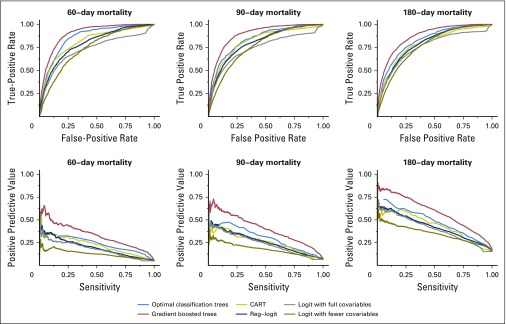
Fig 4.
Receiver operating characteristic curves and positive predictive value versus sensitivity plots for 60-day, 90-day, and 180-day mortality predictions, comparing the following methods: optimal classification trees, CART (classification and regression trees), logistic regression with fewer variables, logistic regression with all variables, regularized logistic regression, and gradient boosted trees.

