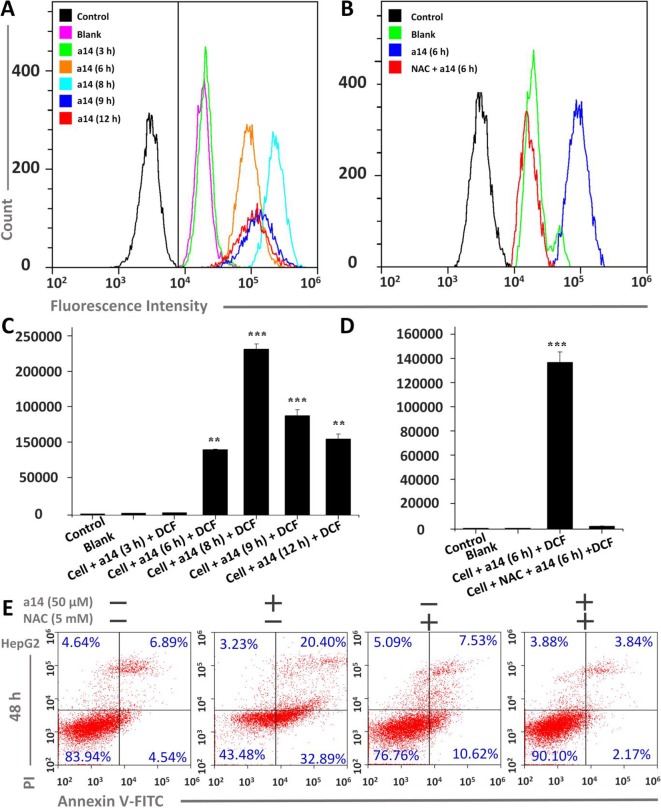
Figure 3.
Changes in ROS levels induced by a14 were probed by DCFH-DA in HepG2 cells. (A) Determination of fluorescence intensity in HepG2 cells under different conditions by flow cytometry; (B) Fluorescence intensity comparison chart with or without NAC; (C) Quantitative analysis of fluorescence intensity in HepG2 cells under different conditions; (D) Quantitative analysis of fluorescence intensity with or without NAC blockers; (E) Flow Cytometric analysis was applied to evaluate the pro-apoptosis of a14 (50 µM) on HepG2 cells for 48 h with or without the intervention of NAC (5 mM). Values are expressed as the means ± SE, by t test, n = 3, **P < 0.01, ***P< 0.001 vs. the black group (cell + DCF).

